Backlog Analysis – Managing the Bottlenecks
The purpose of this project was to help assist my client in understanding its backlog of existing work orders. According to the theory of constraints (from the popular book “The Goal: A Process of Ongoing Improvement”) a manufacturing operation should focus most of its attention on reducing bottlenecks in its process. The bottlenecks are the key limiters to total throughput, and so a dollar invested in alleviating the bottleneck will generally have the greatest return.
My strategy was to take the client’s raw data source and convert into an easy to use, automated dashboard. The source data was a flat list of thousands of work items: WorkItemId, WorkItemStatus (submitted, pending, completed), WorkItemAssignedTo, WorkItemPriority, etc. To identify which work centers were bottlenecked, I grouped the work items along logical dimensions such as work center, work complexity, and aging days. The final deliverable to the workflow manager was the dashboard below:
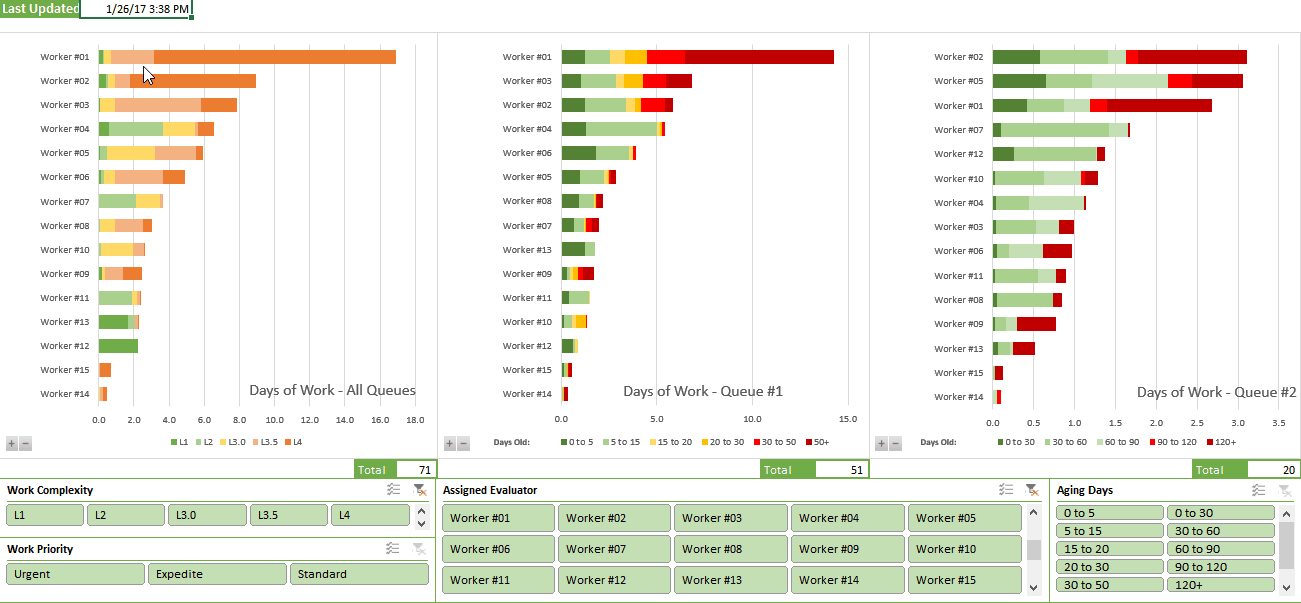
At a glance, the manager could (refer number below to animation above):
- See which workers are bottlenecked and focus attention on helping those workers (left chart)
- Determine the complexity of work in each worker’s queue and visually assess which work can be reassigned to another worker to balance the load (left chart)
- See which workers are most behind on timelines (middle and right charts). The color coding indicates how far behind timeline each worker is, and the length of the bar indicates quantity of work.
- Answer questions about the data using slicers. For example:
- How much of the urgent work is within our advertised timelines?
- How much high-complexity work is there?
Furthermore, individual workers now had direct visibility into the status of their queues and through self-monitoring were motivated to get themselves “out of the red.”
Conclusions and Takeaways
Technical Discussion
My goal was to create a robust report that could be shared directly in the client’s SharePoint intranet portal, be updated with one click, and refresh quickly. I did the following:
- Worked with my client’s IT department to implement improved logging of required events (in a simple data warehouse). This improved report refresh performance from minutes to seconds.
- Wrote SQL queries, wrapped them in Stored Procedures, and connected to this data source in Excel.
- Used VBA to create a parameters table in Excel which passed custom parameters (i.e. start/end date) to query.
- Developed pivot chart visualizations with a variety of slicers for ease of use.
0 Comments